Table of Contents
BPMN (Business Process Model and Notation) - Modern Flowcharting
Flowcharts have traditionally been created using symbols that were standardized in ISO 5807:1985. This now antiquated standard has remained unchanged since its introduction (it doesn't even address “Swim Lanes”). As the flowcharting needs of businesses changed, it was an international, open membership, not-for-profit organization called the Object Management Group® (OMG®) that standardized today's modern flowcharting symbols. This standard is "Business Process Model and Notation" (BPMN). And unlike the ISO standard, this standard is free. If you've never heard of BPMN, you're in for a treat!
The BPMN symbols are included in all of the most popular flowcharting software applications… and several other free flowcharting applications. While similar to the legacy ISO 5807 symbols, the BPMN symbols allow you to create MUCH more specific flowcharts communicating greater detail to the user(s).
For example, the legacy ISO 5807 “Decision” (Diamond) symbol limited users to only one input resulting in a selection of only one of 3 possible outputs! In contrast, BPMN allows for more sophisticated flowcharting (aka “modeling”) - such as using “AND”, “OR”, “AND/OR“, and “EVENT” gateways (with their own unique symbols) and much more.
| Gateway | Meaning |
|---|---|
 | Exclusive “OR” gateway. The process will proceed when ONE of the specified conditions is met (e,g., Yes/No). This could be described as an “If/THEN” gateway. |
 | Inclusive “AND/OR” gateway. The process will proceed when EITHER (or both) of the specified conditions are met. |
 | “AND” (parallel) gateway. The process will not proceed until ALL conditions are met. |
 | Event-Based gateway (e.g., Router/Traveler/Work Order is not released to production until all required material has been received). |
And some common “Event” symbols are…
| Event | Meaning |
|---|---|
 | Intermediate “Send” message (throw). The double circle indicates an “intermediate” event. |
 | Intermediate “Receive” message (catch). |
 | Intermediate “Condition”. The process flow STOPS until this condition is met. |
 | Intermediate “Timer”. The process flow STOPS until the specified time has passed. For example, “Allow product to cure for 15 minutes”. |
 | Escalate and END. The thick circle indicates that the process ends; while the upward arrowhead indicates “escalation”. For example, suppose a corrective action has exceeded its due date for resolution with no response or action by the process owner. The process should “Escalate issue to management”. |
The “Task” symbol is virtually identical to the legacy symbol… except that additional detail can be added by including an icon within the Task box. For example, a “Hand” inside a Task box means that it is a manual task (WITHOUT using a computer). The “User” (Person silhouette) symbol means that a computer was used… such as typing a report or generating an online NCR.
Once you learn what the symbols mean, these are very easy to create. Check out the following examples…
All of the following examples are “Orchestration” process charts (which can include “Swim Lanes” – a concept still not included in the antiquated ISO 5807). BPMN also allows for:
- “Collaboration” process charts… which depict the interaction between different “pools” (not included in ISO 5807), and
- “Choreography” process charts… which depict the way that participants coordinate their interaction (also not included in ISO 5807).
I don't use “Choreography” process charts because they are only beneficial in very specific situations. You can read more about these differences here.
ISO 9001:2015 Flowcharts
The BPMN diagrams shown below depict the generic ISO 9001:2015 requirements for 8.7 “Control of Nonconforming Outputs” & 10.2 “Nonconformity and Corrective Action”.
I created these diagrams using the free (open source) “Camunda Modeler” diagraming software, which is available from: https://camunda.com/download/modeler/. While there is no “standard” color for the symbols, Green is typically used to start a process, and Red typically indicates the end of a process. I've also used Blue to call attention to intermediate events… and Yellow to highlight Time-related events (in the AS9100 process for “Nonconformity and Corrective Action).
ISO 9001:2015 Control of Nonconforming Outputs Diagram
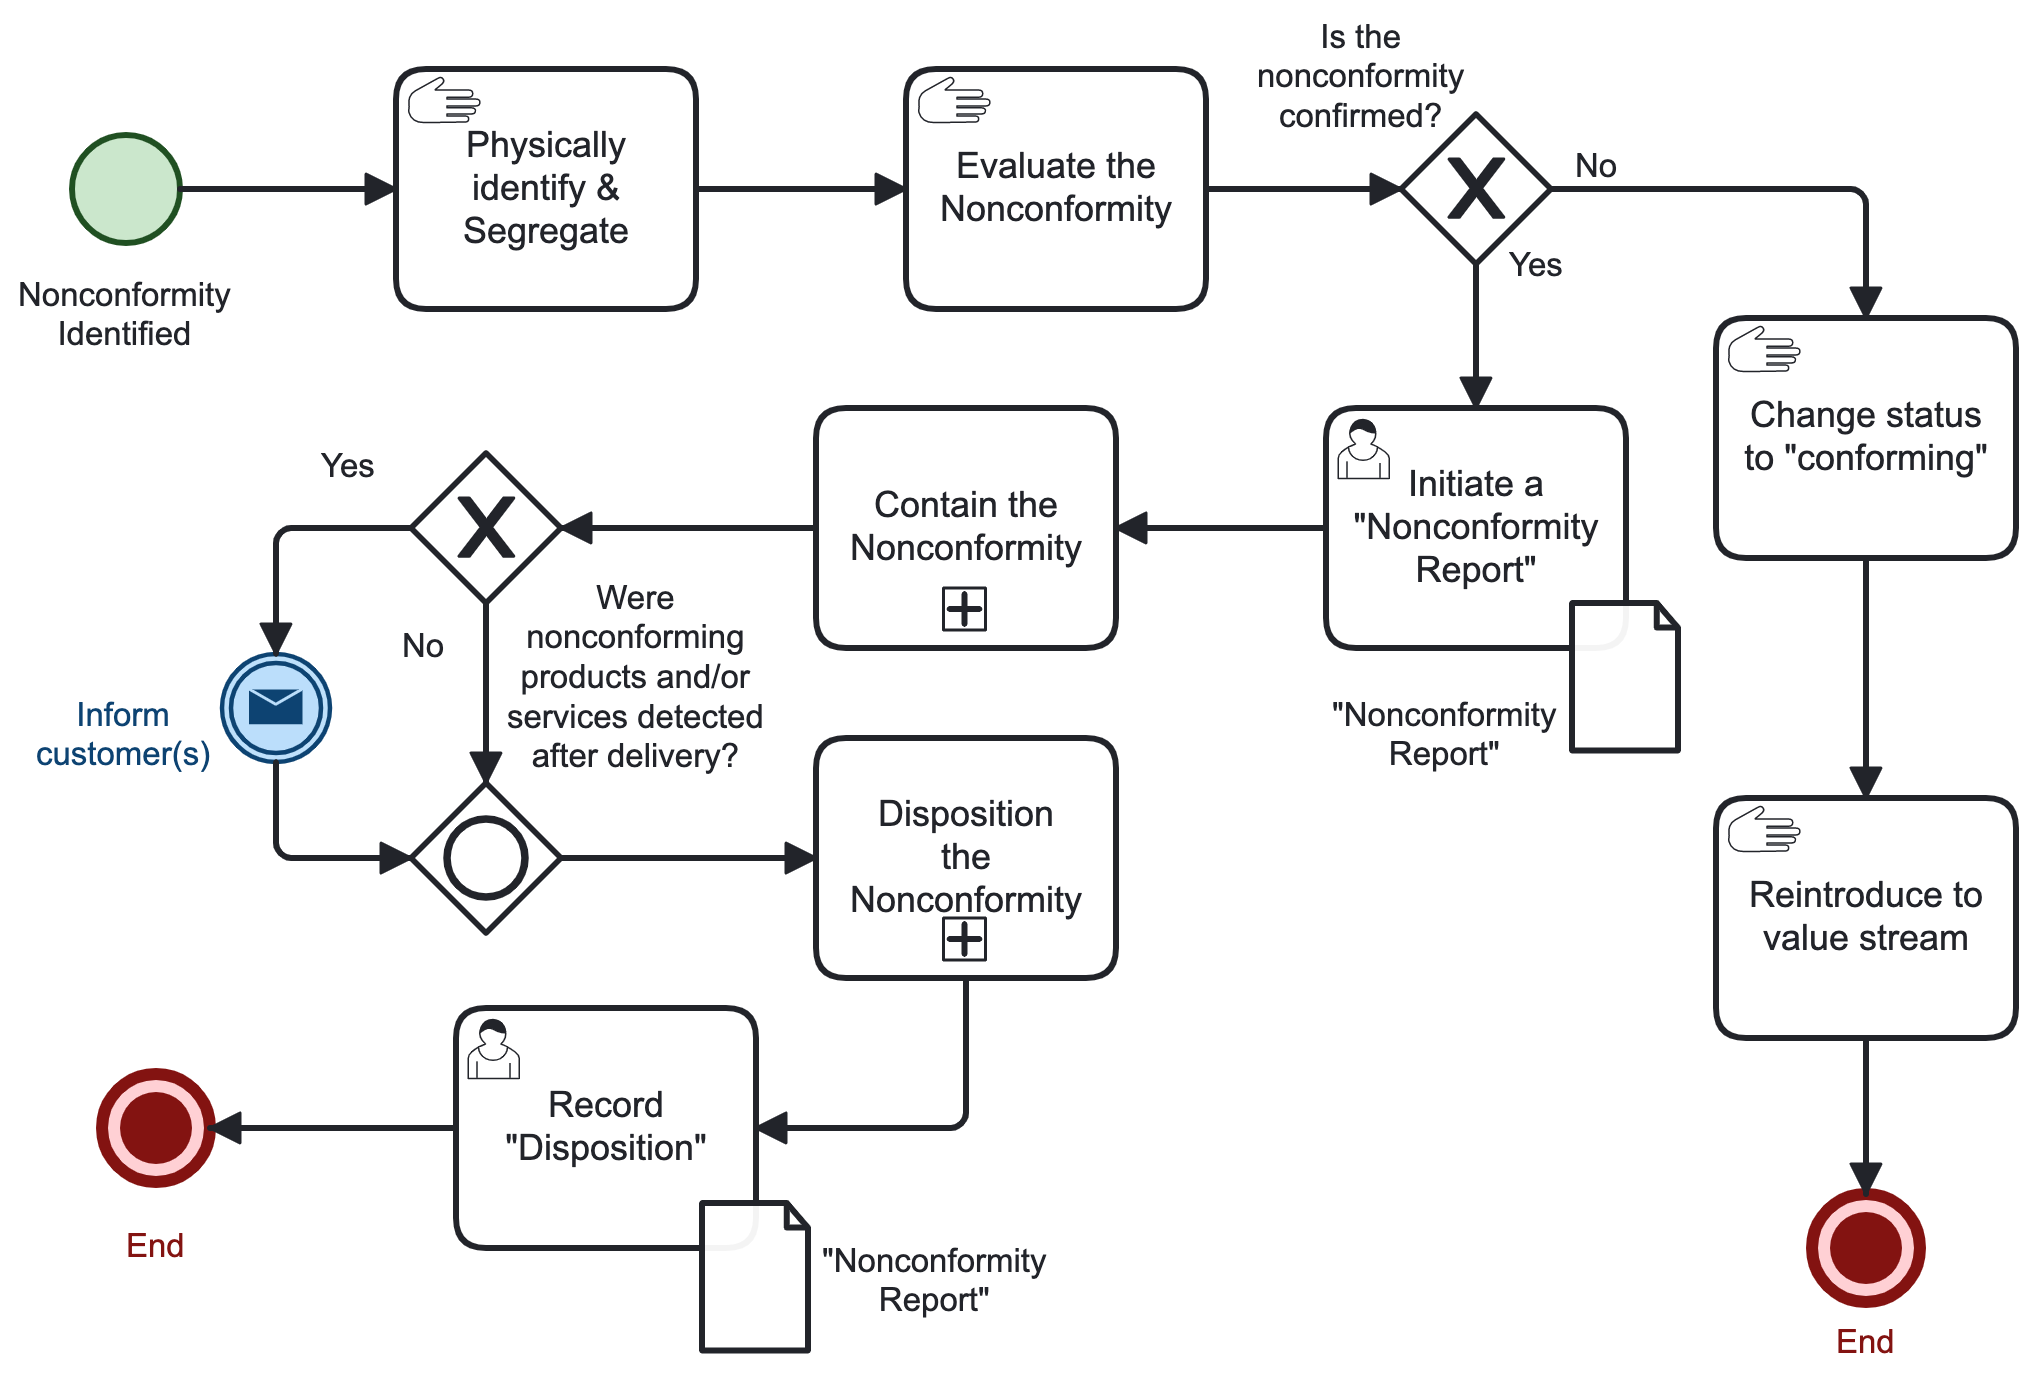
You'll also notice that the “Contain the Nonconformity” and “Disposition the Nonconformity” tasks include a small box containing a “+” symbol. This indicates that this task is a subprocess… containing other steps not specifically identified here (I usually describe those sub-processes using text in the associated procedure).
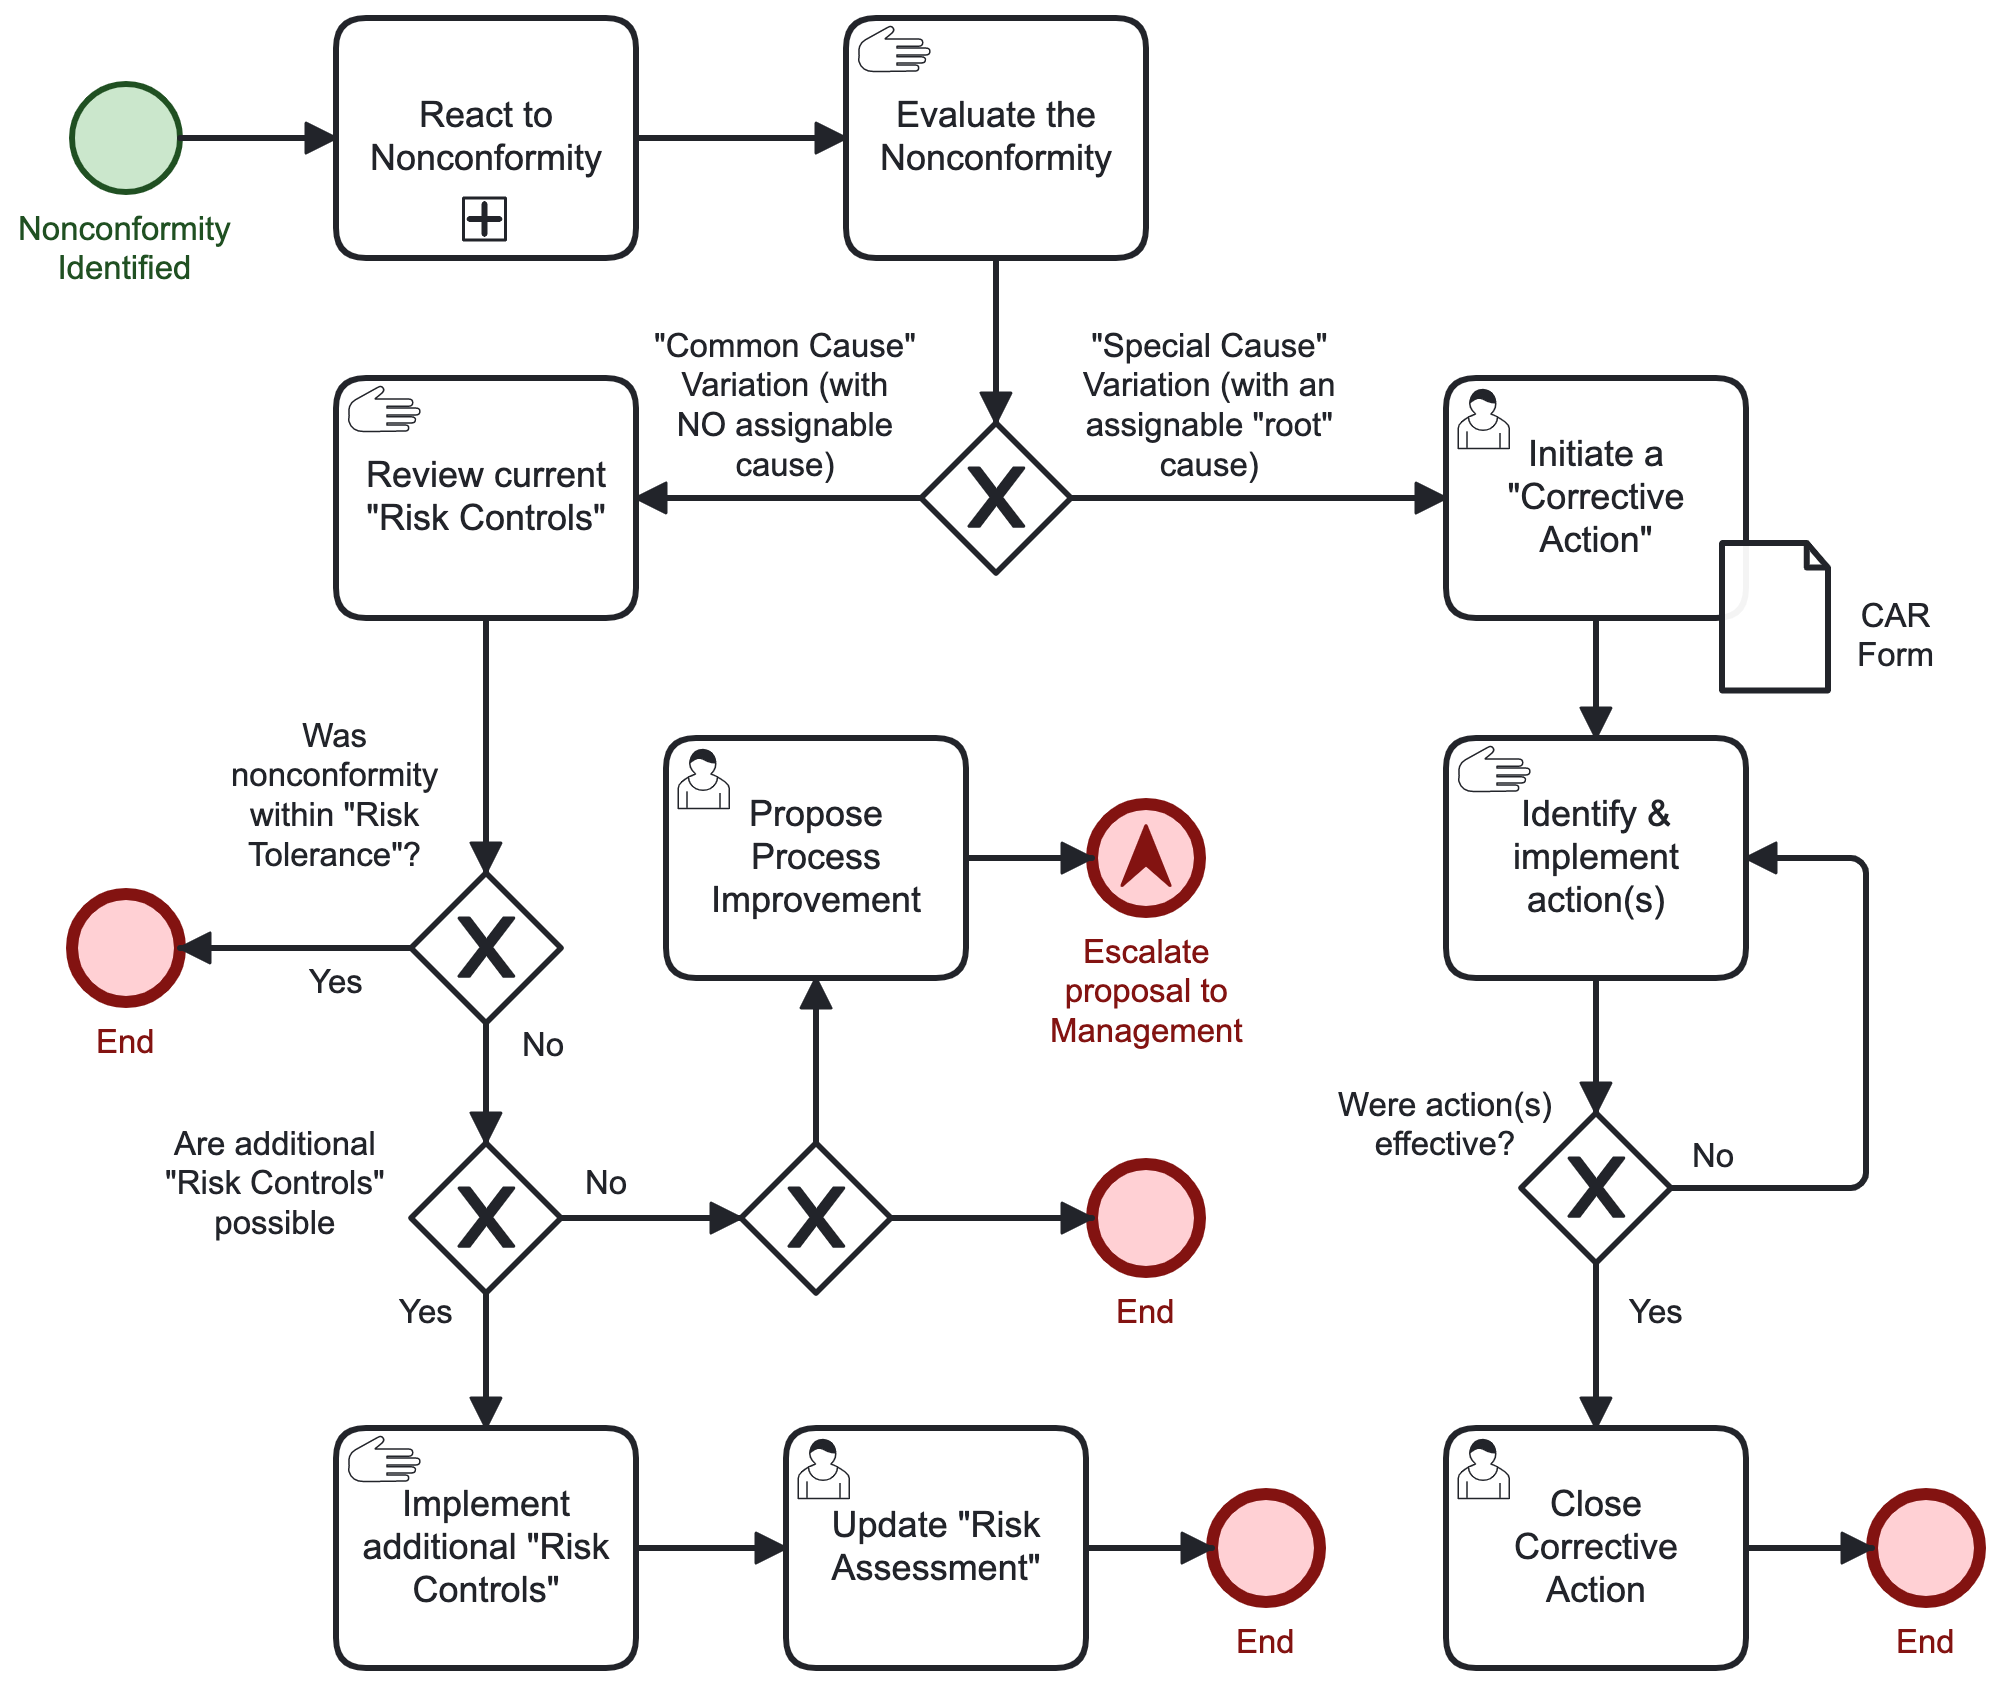
ISO 9001:2015 Nonconformity and Corrective Action Diagram
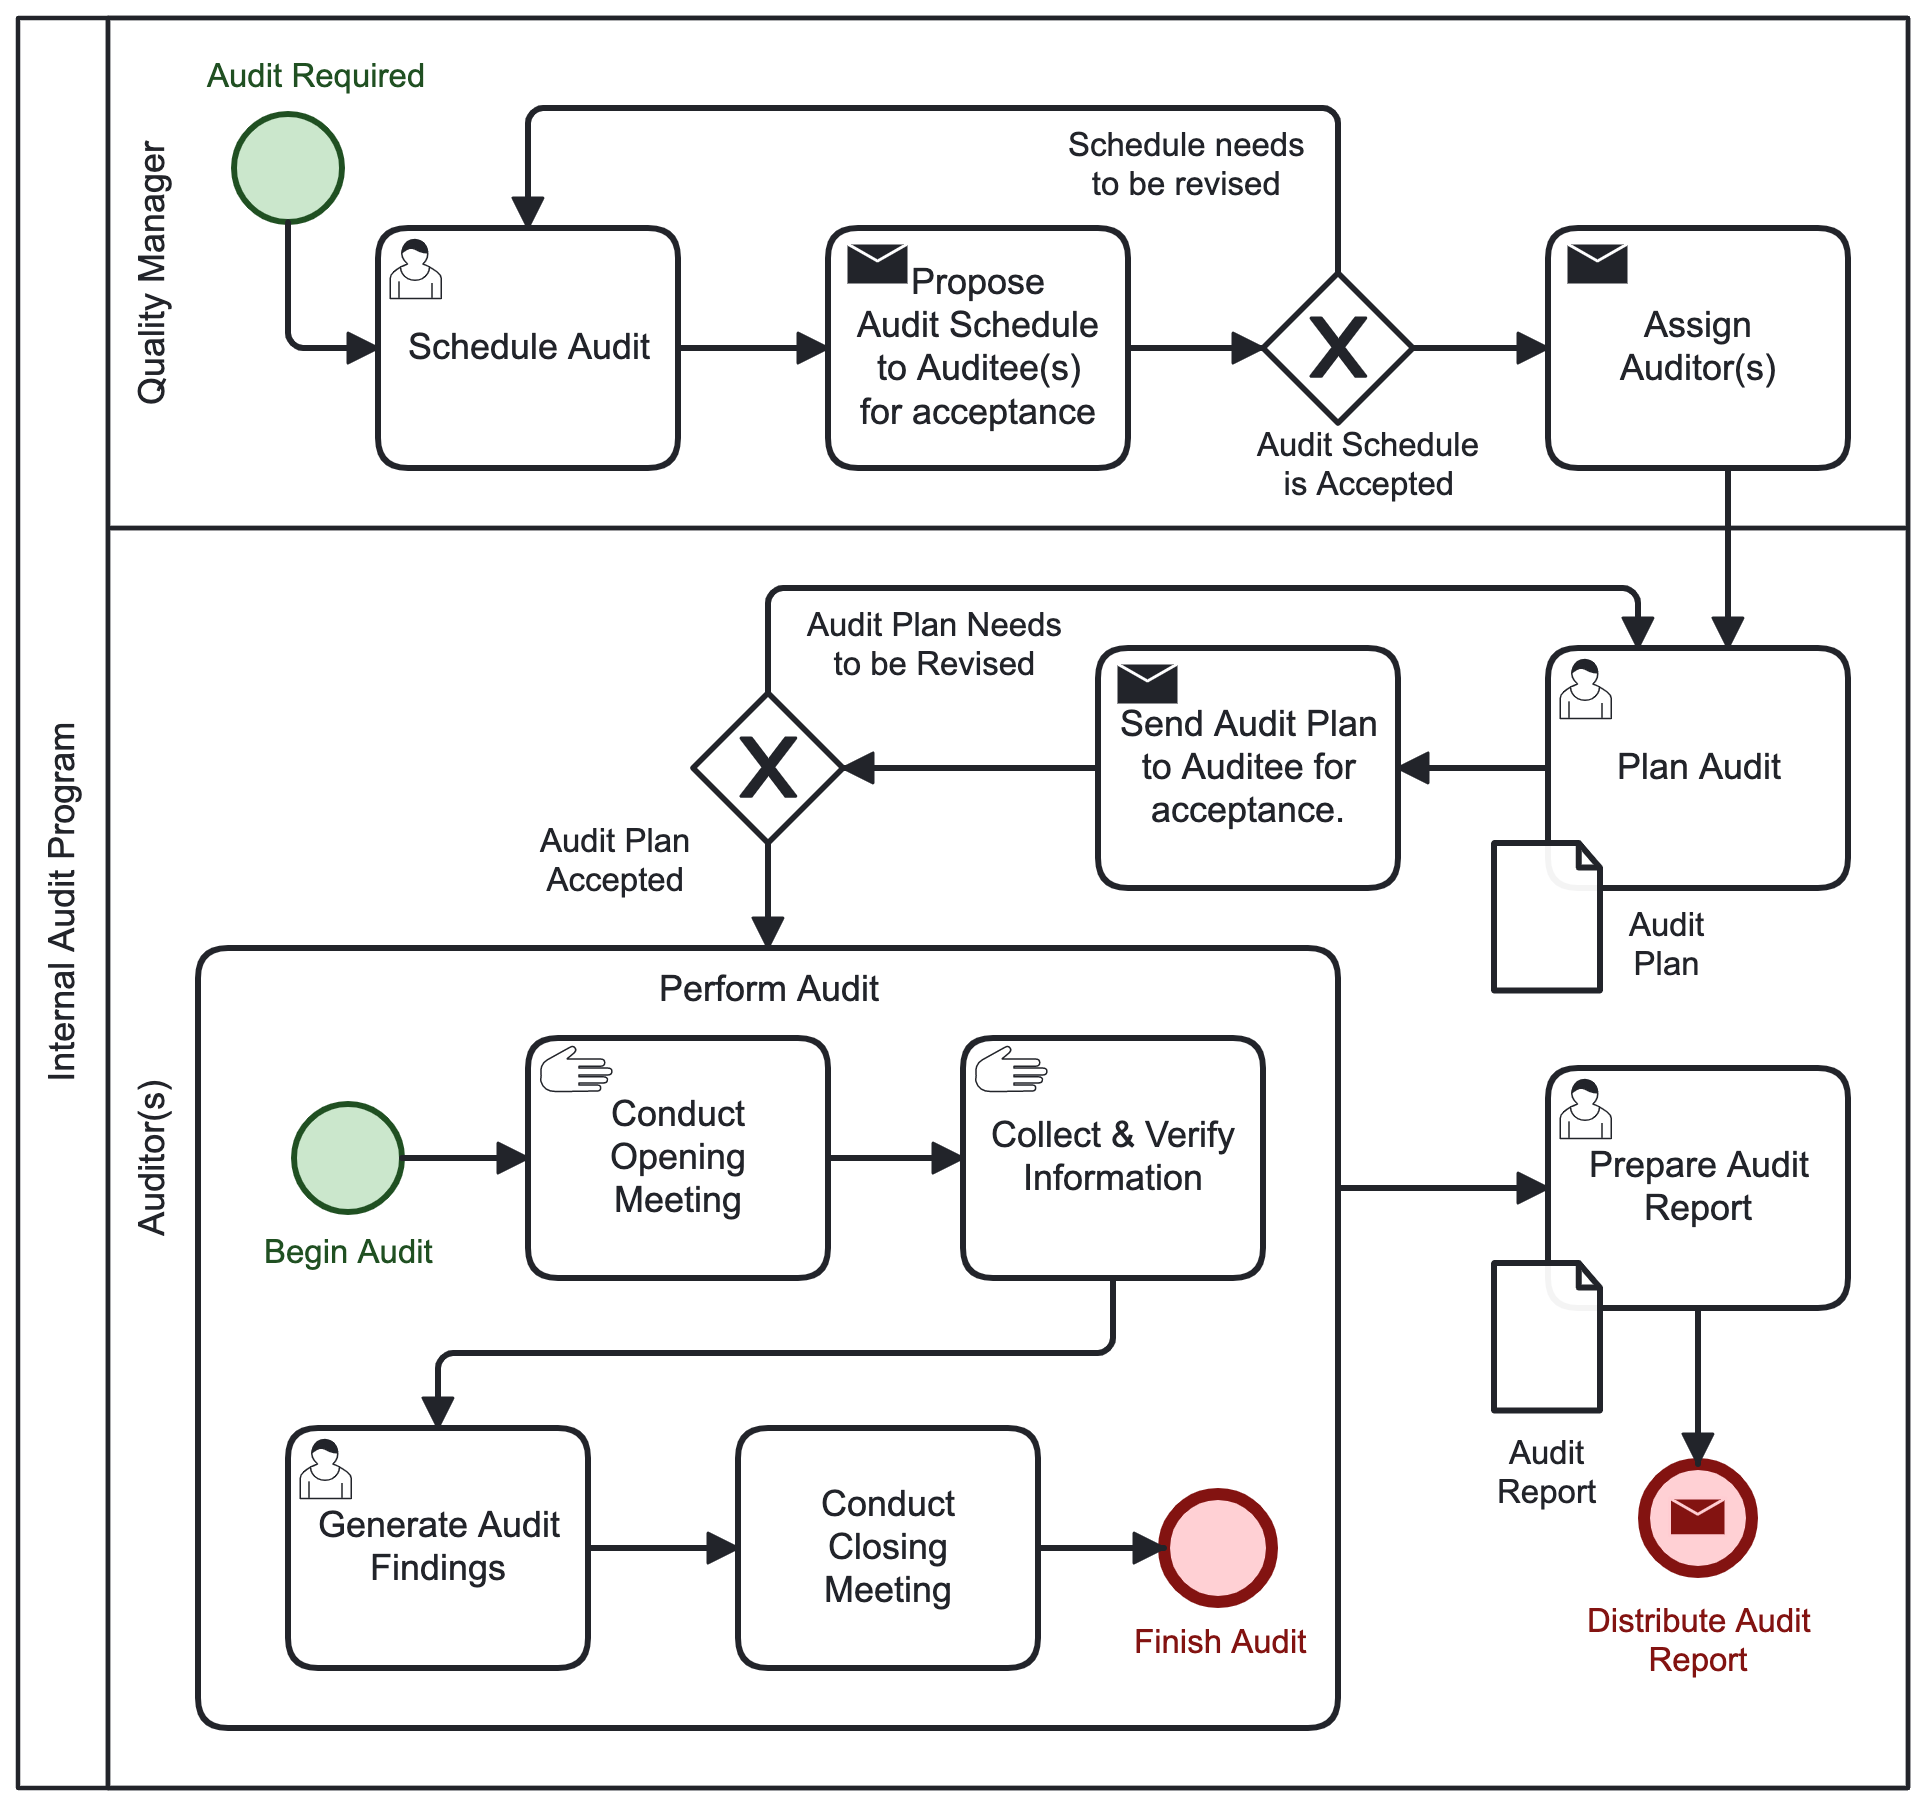
ISO 9001:2015 Internal Audit Program Diagram
The main differences between the below diagram and the previous diagrams is that it (1) utilizes “Swim Lanes” (a concept still not included in the antiquated ISO 5807, even though it was re-affirmed in 2019) AND (2) it includes a sub-process (“Perform Audit”) shown within the diagram.
AS9100:2016 Flowcharts
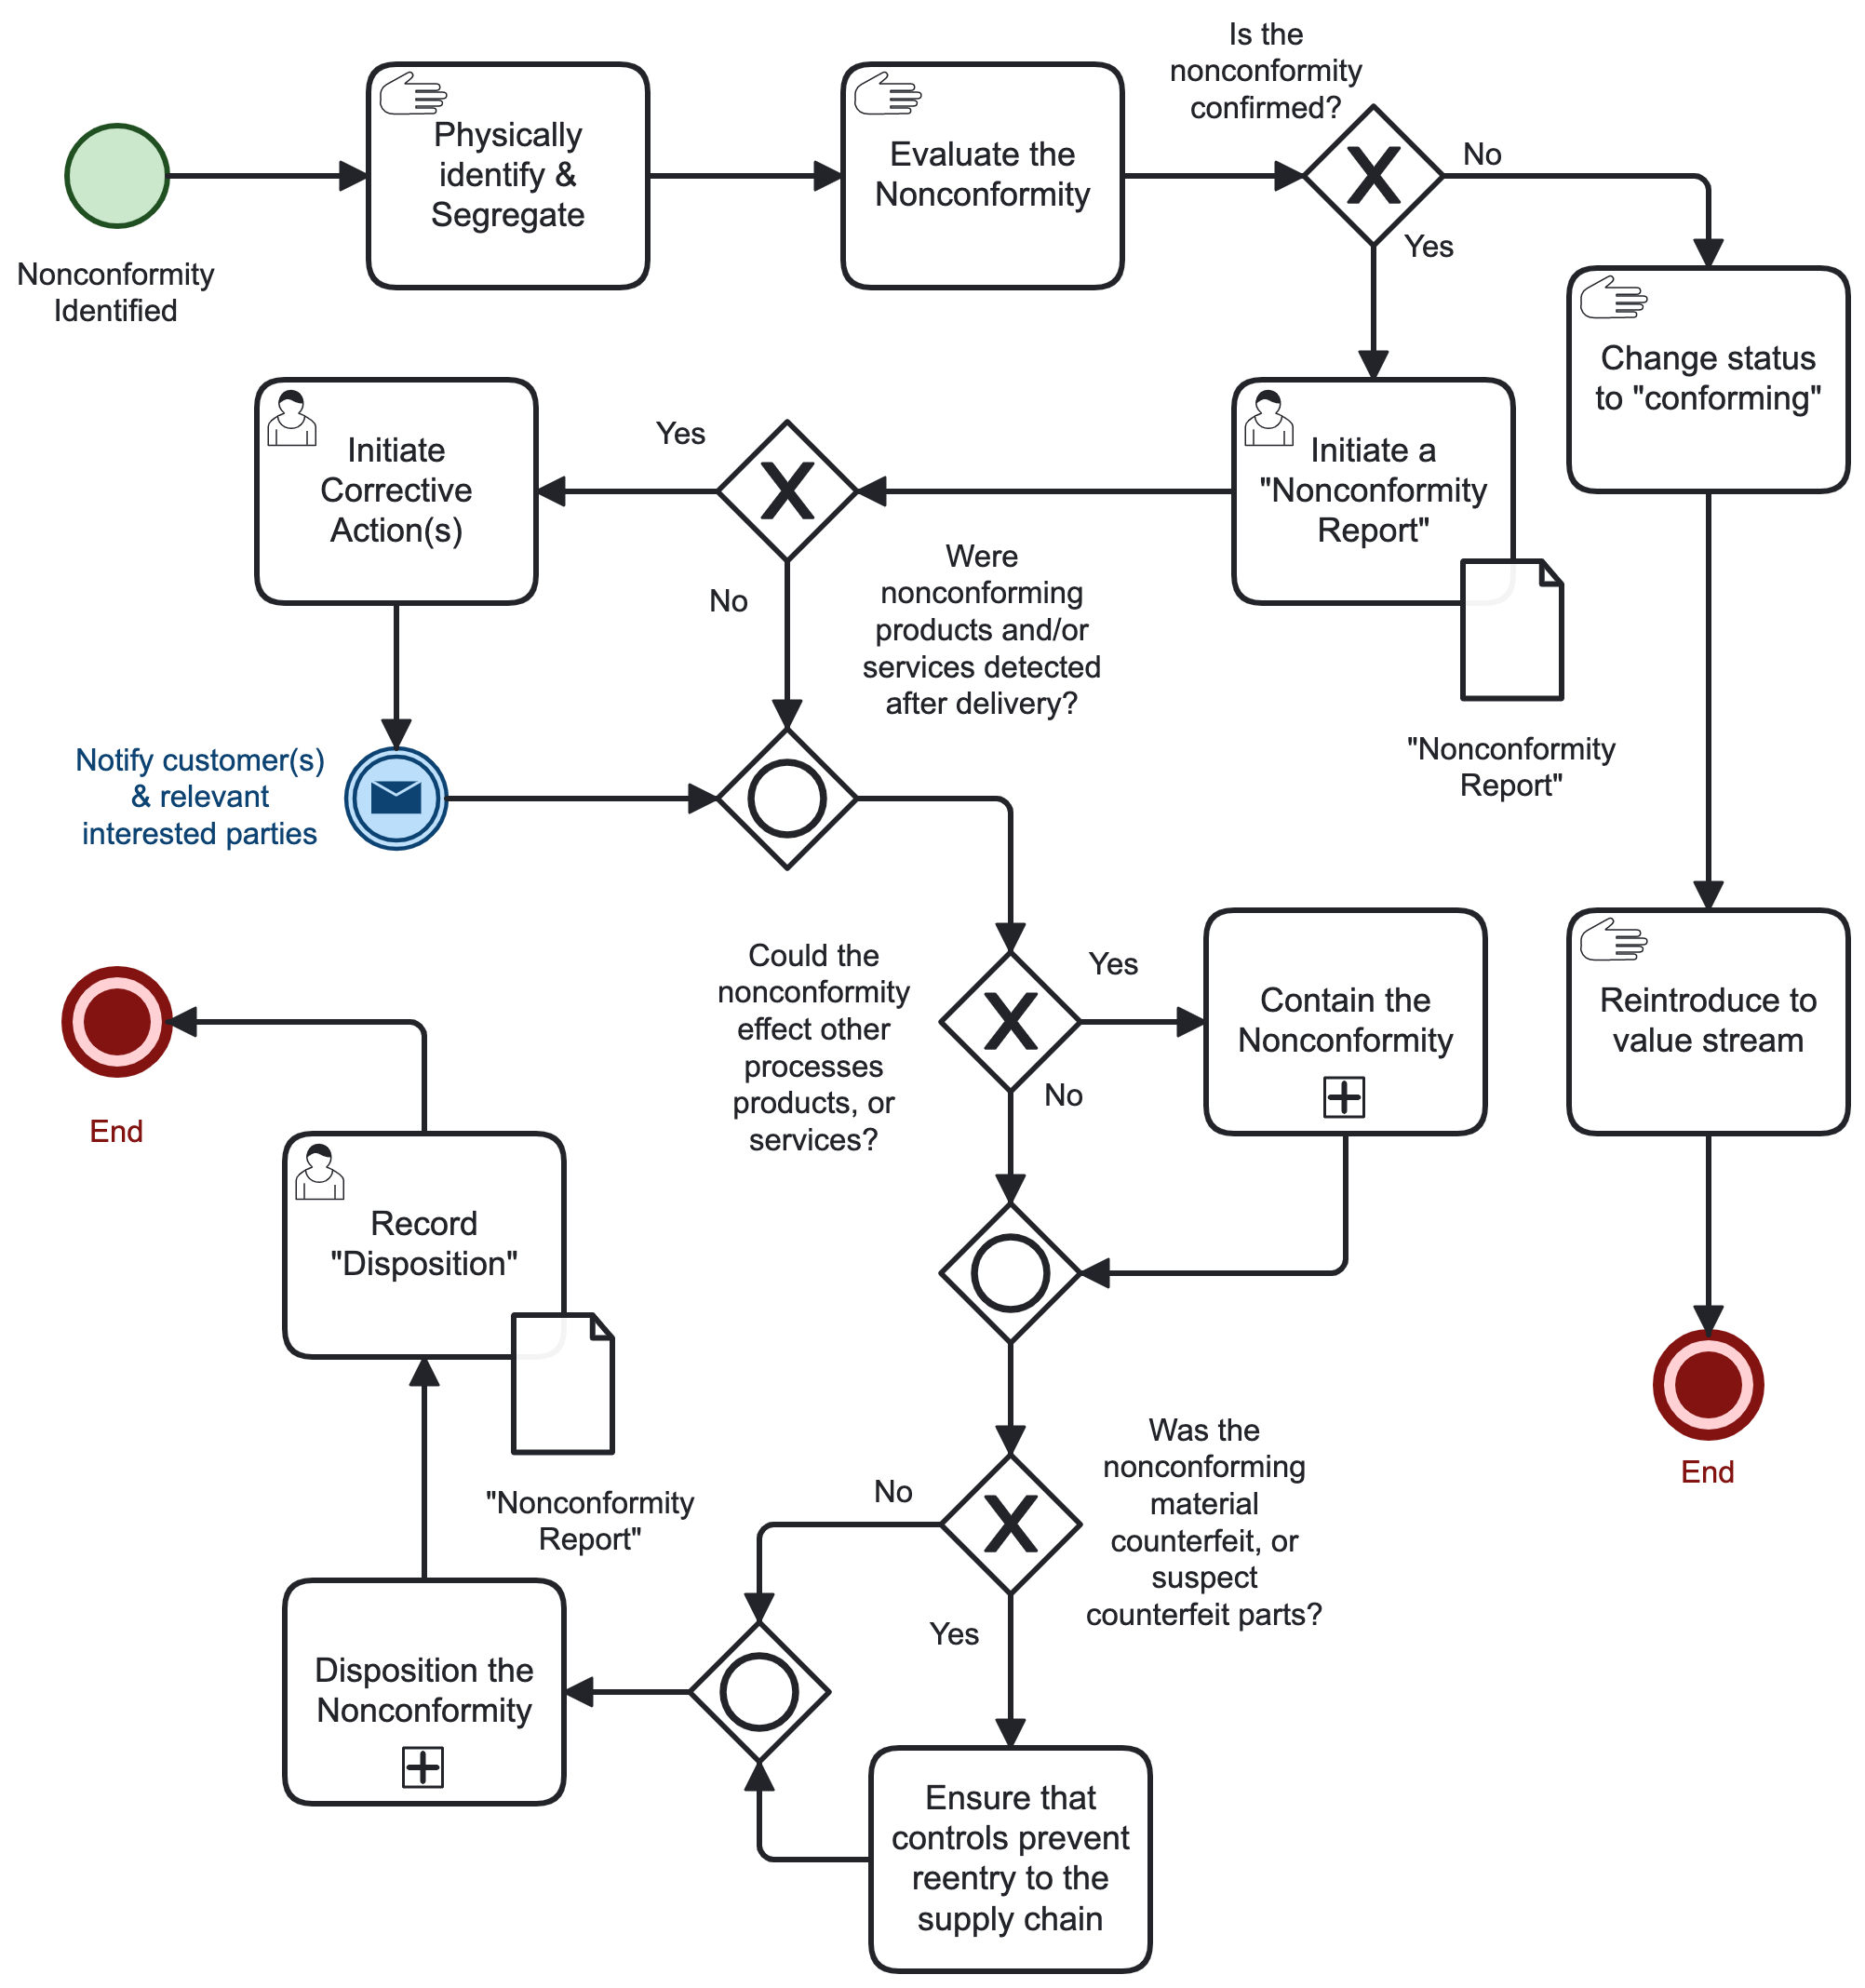
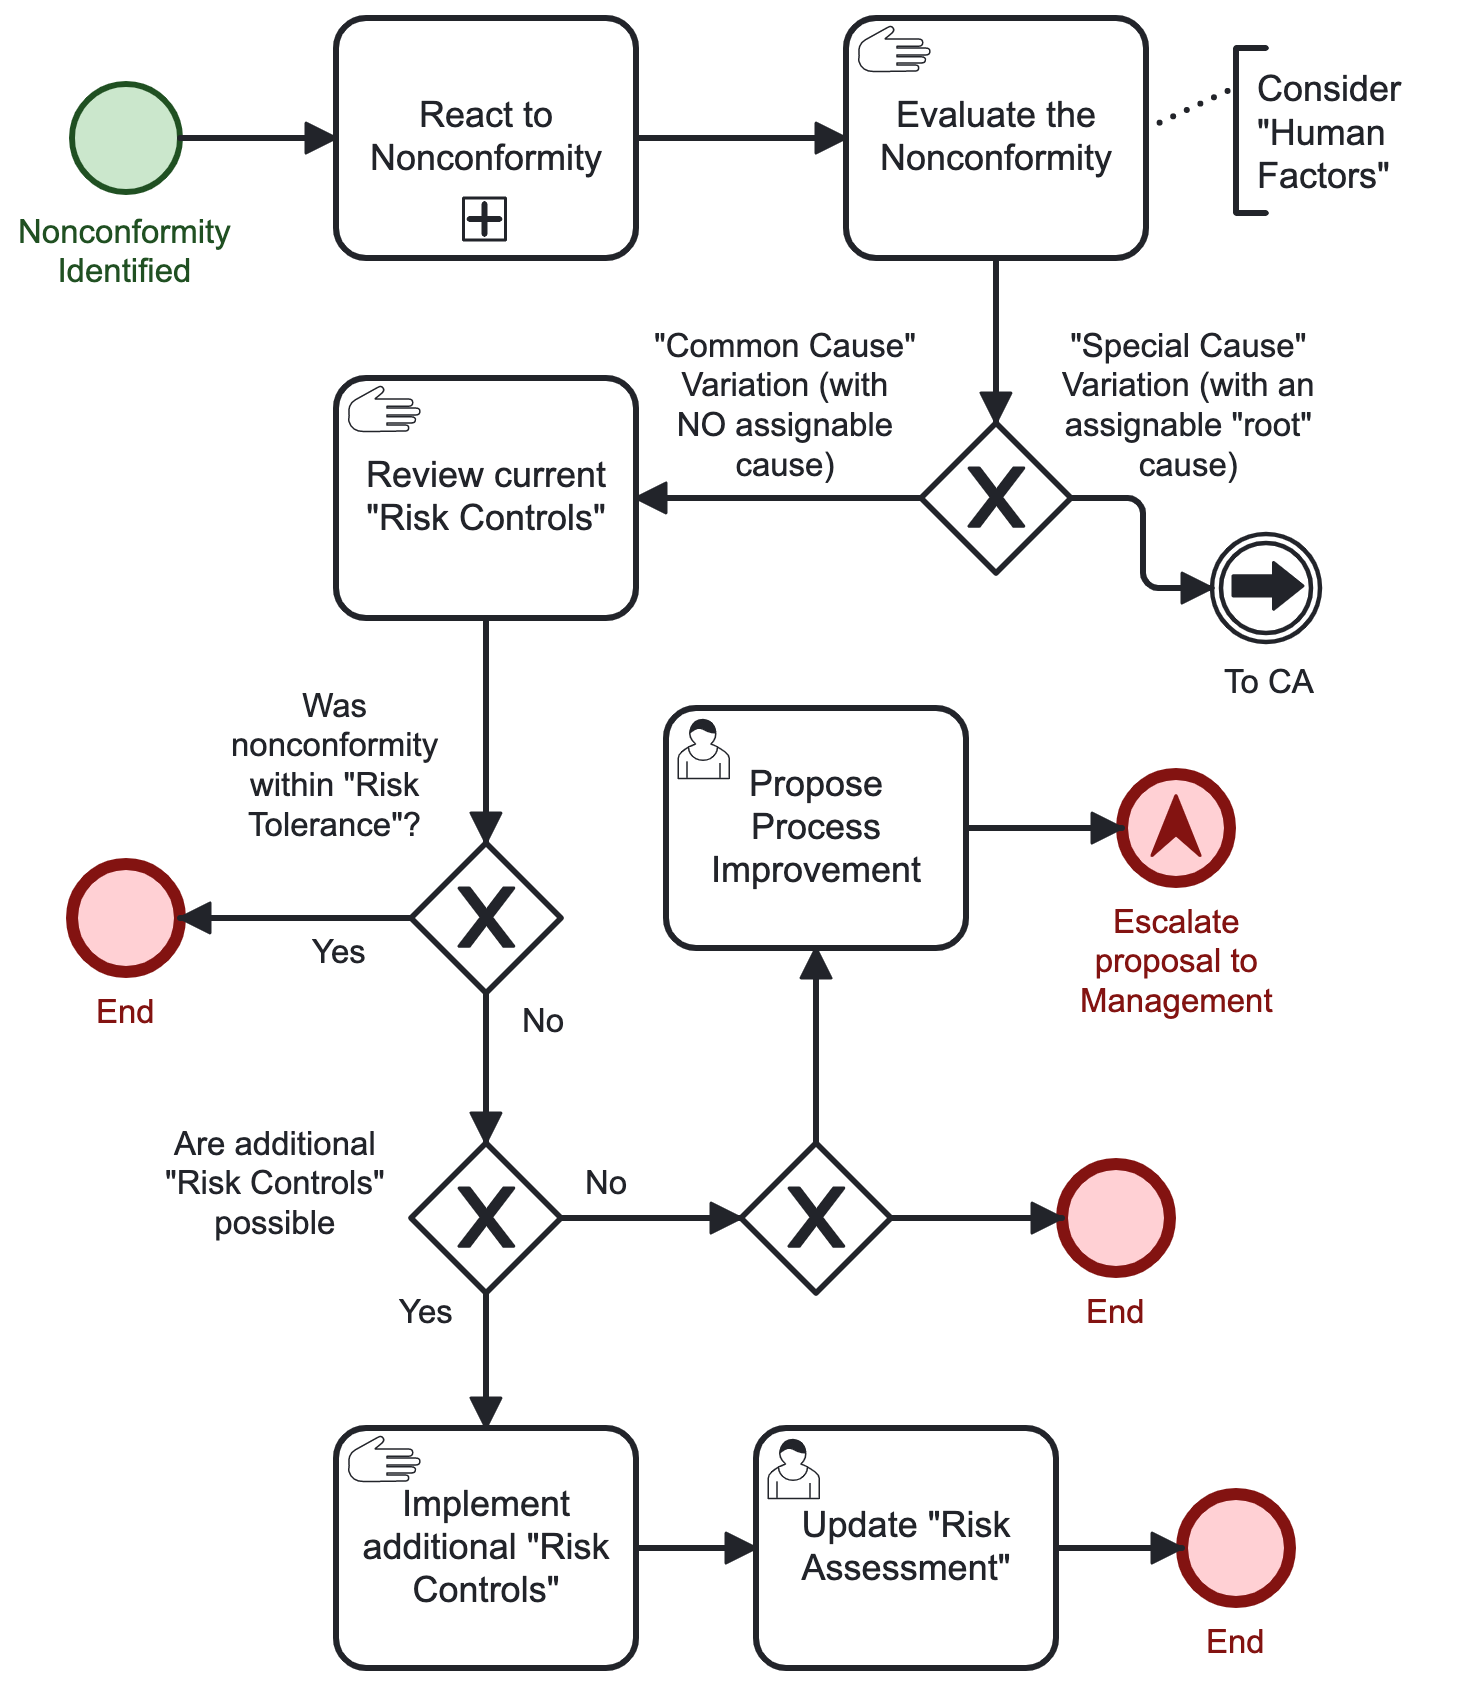
And the BPMN diagrams shown below depict the generic AS9100:2016 requirements for 8.7 “Control of Nonconforming Outputs” & 10.2 “Nonconformity and Corrective Action”. These diagrams are slightly more complex than the ISO 9001 diagram because AS9100 includes additional requirements.
AS9100:2016 Control of Nonconforming Outputs Diagram
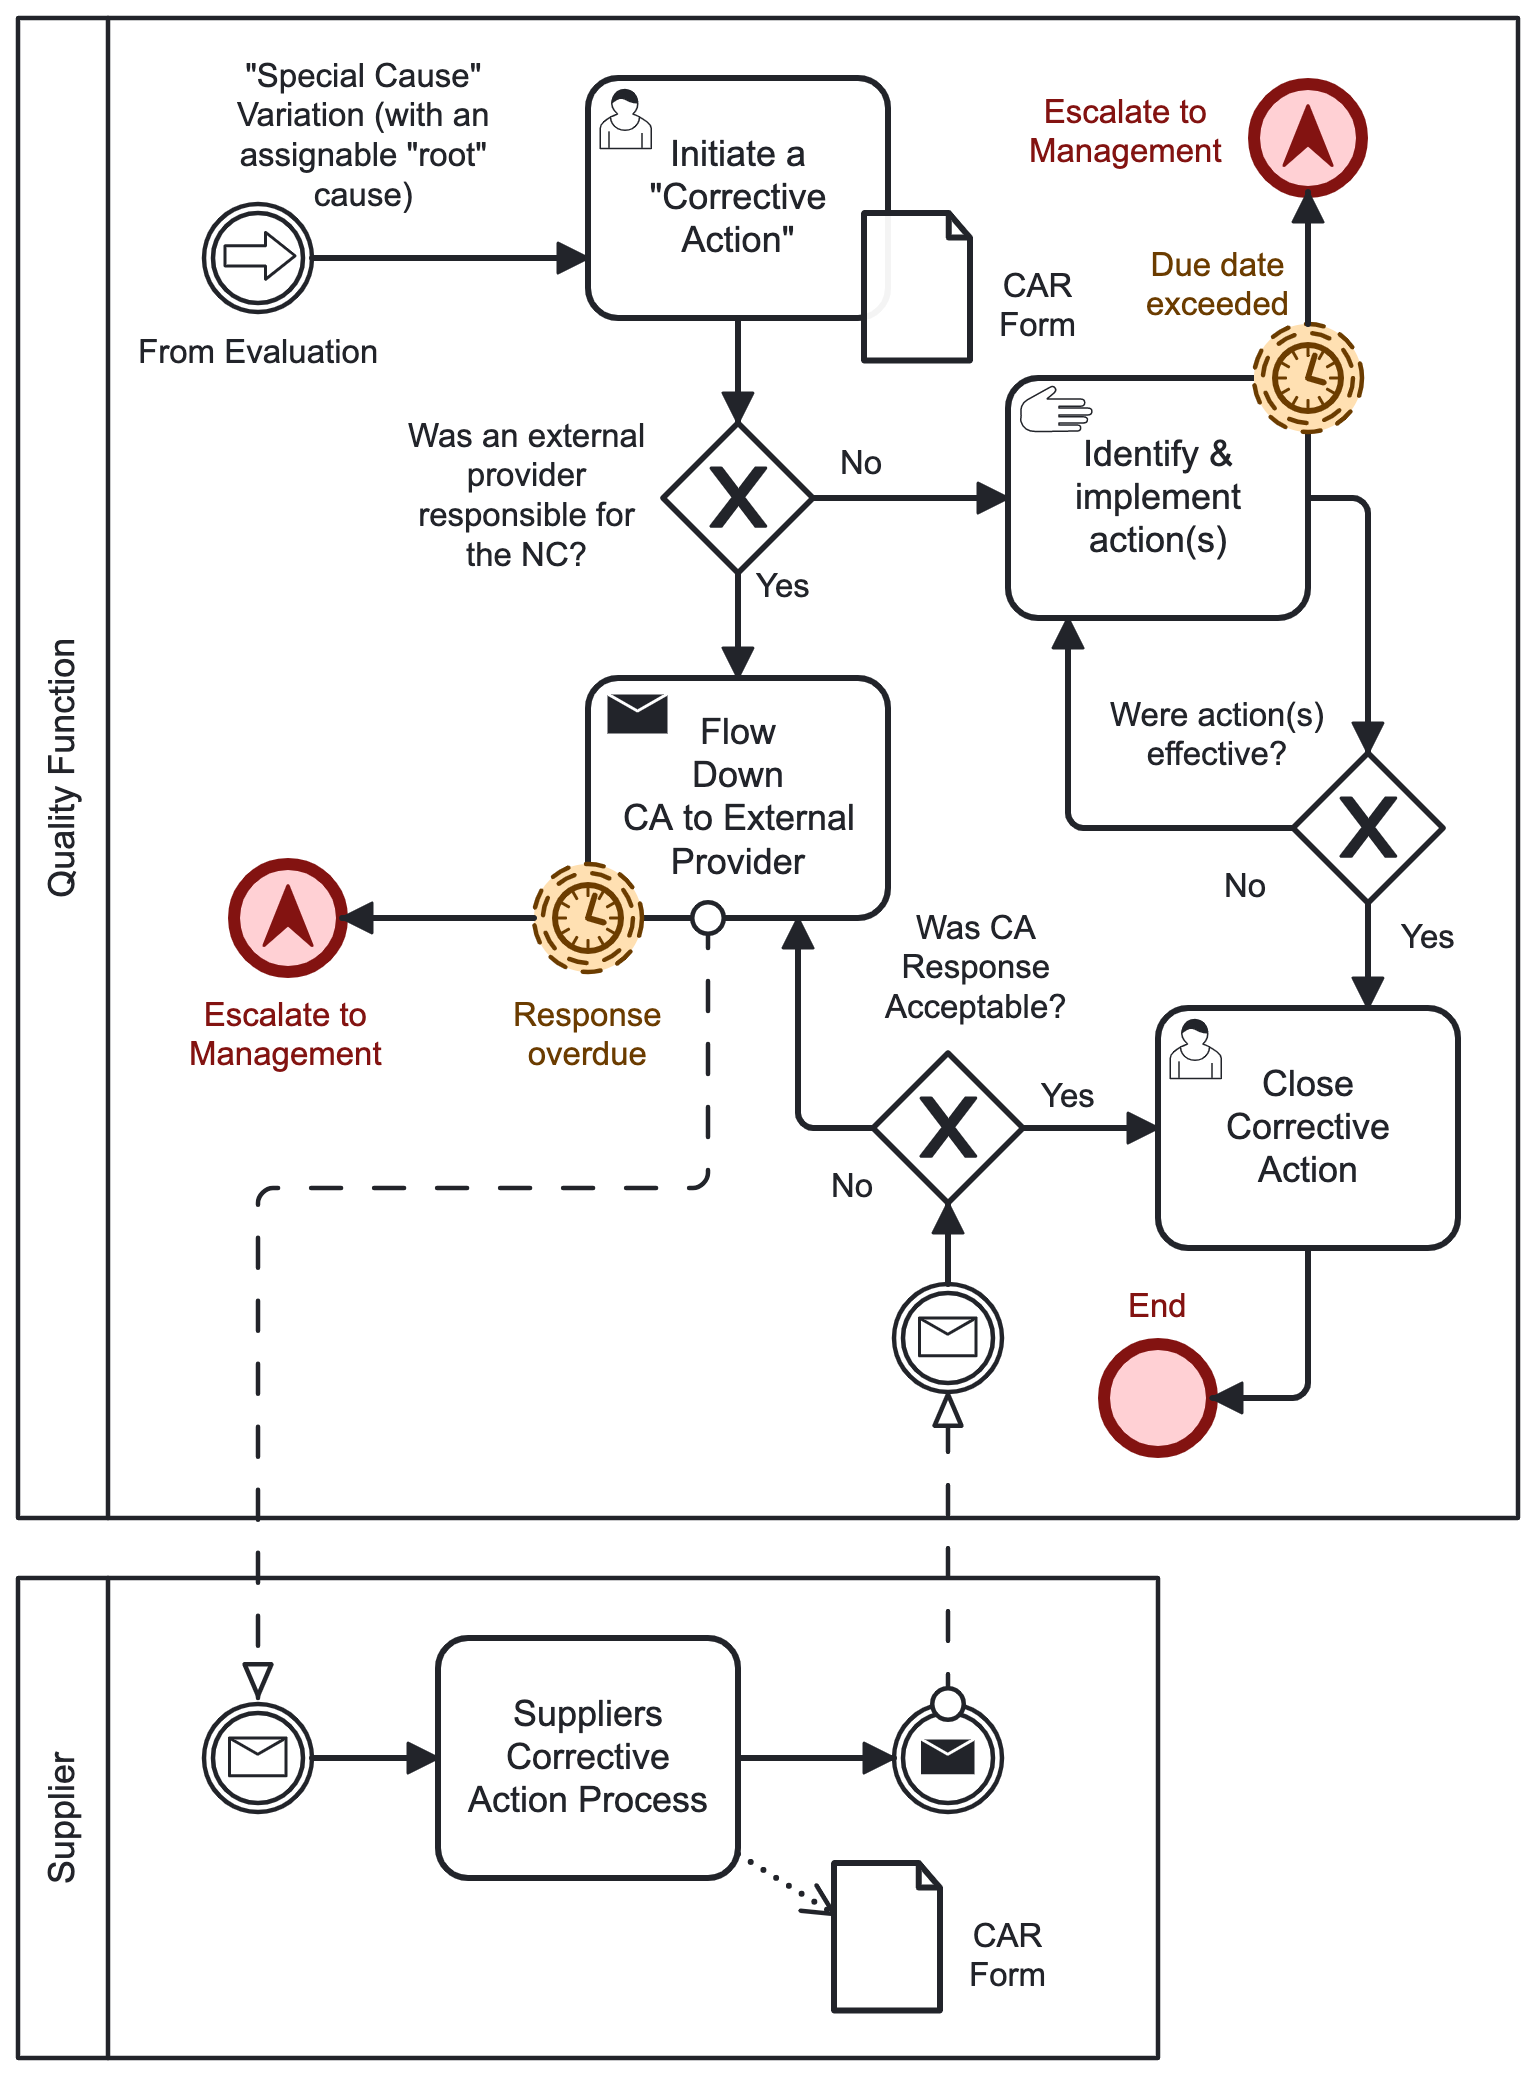
AS9100:2016 Nonconformity and Corrective Action Diagram
The flowchart continuation depicts the corrective action process when the cause has been determined to be assignable (i.e., a “Special Cause” variation). The below continuation is an example of a “Collaboration” process chart (depicting the interaction between different “pools”).
Free BPMN Software
Desktop
All of the BPMN diagrams on this page were created using “Camunda Modeler” (Desktop, version 5.9). You can download the editable files for all of the above diagrams here: bpmn_process_diagrams-editable_03-17-23_.zip
Diagrams.net (Draw.io) defaults to the traditional ISO 5807 flow chart symbols. So you must select the BPMN 2.0 symbols. To do this, select the blue button on the left side of the screen labeled “+ More Shapes”. This will bring up the “Shapes” dialog box. Scroll down to the “Business” section (in bold with a grey background), and check the box next to “BPMN 2.0”. Then click “Apply”. To learn more about using BPMN in Draw.io Desktop, visit: https://www.diagrams.net/blog/bpmn-2-0
Web-Based BPMN
Video Tutorials
Check out these short videos (which actually focus on the web-based "Cawemo", but the desktop version (“Camunda”) works the exact same way):
BPMN Tutorial - Part 01: Simple BPMN Process in 3 min
https://www.youtube.com/watch?v=odhFiGcqwtw
BPMN Tutorial - Part 02: XOR Gateway in 4 min
https://www.youtube.com/watch?v=t2Yf0BGs3mQ
BPMN Tutorial - Part 03: Parallel Gateway in 5 min
https://www.youtube.com/watch?v=bP7TUmji03Y
BPMN Tutorial - Part 04: Pools and Lanes in 2 min
https://www.youtube.com/watch?v=7SgXpINqSdU
BPMN Tutorial - Part 05: Message Events in 4 min
https://www.youtube.com/watch?v=b5Ty5e033O0
There are a TON of other BPMN tutorial videos from other people.
Free Books
The Ultimate Guide to BPMN2 https://www.bonitasoft.com/system/files/documentation_library/ultimate_guide_to_bpmn2_280116.pdf
While hardly the “ultimate” guide, this PDF offers a nice little introduction to BPMN and is very good at explaining what the symbols mean.
Also, a free symbol “reference” is here: https://camunda.com/bpmn/reference/
Other Resources
Another good resource (from a College Course) is:
An Introduction to BPMN2 (ppt) http://www3.cis.gsu.edu/dtruex/courses/CIS4120/Sessions/Session%203%20-%20Level%201%20BPMN/Introduction_to_BPMN/Introduction%20to%20BPMN.pdf
Understanding BPMN Connections http://www3.cis.gsu.edu/dtruex/courses/CIS4120/Sessions/Session%203%20-%20Level%201%20BPMN/Introduction_to_BPMN/Understanding-the-bpmn-connections-Orbus.pdf