Table of Contents
DMAIC - For Improvement
DMAIC is a FANTASTIC process improvement methodology. While I've been unable to determine its origin (whether from the Lean concept or Six Sigma approach), it was an integral part of GE's Six Sigma program during the late '90s. GE saved $12 billion over five years and added $1 to its earnings per share 1)
DMAIC: A data driven quality strategy for improving processes and an integral part of a Six Sigma quality initiative. DMAIC is an acronym for define, measure, analyze, improve and control.
While I generally agree with the above definition, I'd change the phrasing of “…quality strategy…” to more correctly describe DMAIC as a “methodology”. And while the DMAIC improvement methodology is “an integral part of a Six Sigma quality initiative”, I'd delete that language because DMAIC can be used by companies who are not implementing six sigma (or Lean Six Sigma). My simpler definition would read:
DMAIC: A data-driven methodology for improving processes. DMAIC is an acronym for define, measure, analyze, improve and control.
What is DMAIC

Far too often, I see flawed or overly restrictive explanations of “what” DMAIC is. Below is a more accurate description:
Define:
The first stage of the DMAIC improvement process is to “define” the “problem”.
A “problem” is the “gap” between where you are and where you want/need to be. When defining the problem, be aware that the DMAIC methodology can be used in response to either an existing quality-related nonconformity or simply a business-related improvement (e.g., to improve efficiency). Be sure to define the scope (e.g., specific products impacted) and boundaries (e.g., specific production area(s) where the problem exists).
The problem should be defined at a high level. For example:
“During the last 4 months, the number of late deliveries of Part No. A2156 (Rev. C), from the Assembly area, have been increasing.“
In the next step, we'll gather information to provide greater detail as to size of “problem” (i.e., measuring the “gap” between where you are and where you want/need to be).
Measure:
The “Measure” stage typically involves creating a ”Data Collection Plan“. This includes identifying those measurements that are pertinent to the scope of the problem. Common examples include:
- FPT (First Pass Yield) - to determine the number of defects being produced by the process
- Throughput Time - including the time spent (1) waiting, (2) processing, (3) inspection/testing, (4) movement, etc. from the point of entry to the point in which the product is released to the next step in the value stream.
This high-level data will help the team develop more focused/meaningful measurements that can be used to identify the contributing factors to the problem. For example, if there FPY is low, then this may be due to (1) inexperienced (new) workers receiving inadequate training, (2) inadequate Work Instructions, (3) worker fatigue, (4) defective components received from one or more suppliers, etc.
In addition, capturing data for a Pareto Chart of the most common nonconformities may offer greater insight into the problem. If the problem can be isolated to a specific part, this could indicate (1) a supplier issue, (2) a design issue, (3) a workmanship issue involving the part, (4) the lack of a sufficiently detailed Work Instructions, etc.
<note important>While a Pareto Chart can be useful, it will not differentiate between defects due to ”Common Cause“ vs ”Assignable Cause“ variations in a process.</note>
If the Throughput Time is lower than planned, this may be due to (1) Supplier delivery delays, (2) production “bottlenecks”, (3) process inefficiencies, (4) repetitive machinery breakdowns, etc.
While many of these examples point to areas outside of the initial scope area, once identified, we can expand the scope to include those areas contributing to the problem. The source of the problem may actually be an “input” to the process being analyzed.
Analyze:
Upon obtaining measurement data, the next task is to analyze the data to determine the various causes leading to, or contributing to the problem. Students of ”causal analysis“ techniques typically learn the simplest techniques first, then only learn more complex/sophisticated techniques if needed (assuming that this learning is guided by a mentor or an instructor):
- 5 Whys
- 5 Whys with Tree Diagram (for addressing multiple causes)
- Fishbone (Ishikawa) Diagram (for addressing multiple causes from multiple sources)
- Events & Causal Factors Charting (for addressing multiple causes associated with their conditions)
- Fault Tree Analysis (for including AND, OR & AND/OR conditions with multiple sources)
- Apollo Root Cause Analysis (Using a “Reality Chart” approach)
Unfortunately, most of the above techniques assume that the solution(s) will become obvious through the causal analysis process. It should come as no surprise that the simpler techniques are the most popular… because they can be effective in solving simple problems with few causes and obvious solutions. Psychologically, this provides a large number of “wins”; with little work or knowledge required. Consequently, most quality professionals have chosen to focus on “Causal Analysis”; with the assumption that if the cause is understood, then the solution will be obvious. Perhaps they were focused on Einstein's quote:
“If I had only one hour to save the world, I would spend fifty-five minutes defining the problem, and only five minutes finding the solution.”
~ Albert Einstein
However, the larger, true “root cause” for most of these simple problems often eludes many quality professionals. The all-encompassing “root cause” is poor planning. The issue with focusing on “Causal Analysis” rather than true problem-solving likely relates to a different quote from Einstein:
As the complexity of the problems increases, more sophisticated causal analysis techniques are required. And the solution becomes more evasive.
Improve:
With so much focus on “causal analysis”, it is unfortunate that the vast majority of Quality Professionals remain oblivious to any sort of structured problem-solving!
We must acknowledge that in order to improve, we must be innovative (inventive).
If you're like most Quality Professionals, you've never heard of TRIZ… or perhaps you considered it something only useful for Engineers. In reality, TRIZ is a structured approach applicable to solving virtually any problem.
TRIZ is the Russian acronym for “Theoria Resheneyva Isobretatelskehuh Zadach”; which translates into English as the “Theory of Inventive Problem Solving”. TRIZ was developed between 1946 and 1985, by Engineer and Scientist Genrich S. Altshuller and his colleagues. The premise of TRIZ is that there are universal principles for innovation. TRIZ identifies and codifies these principles so that they can be used to add structure and standardize the process for innovation.
Who should be on your improvement team?
The below chart (recreated from ”TRIZ for Engineers - Enabling Inventive Problem Solving“ - By Karen Gadd of Oxford Creativity) reveals that a company can increase the likelihood of an effective solution from 32% to 77% by simply involving external Subject Matter Experts (SMEs) modifying solutions used in similar systems from within the same industry! And an additional 18% of improvements come from SMEs adopting a new application from a different industry.
So, while a “Quality Circle” (relying solely on internal resources) would only provide a 32% chance of providing an effective solution to a problem, assembling a team consisting of a representative from Levels 1, 2 & 3 (below) AND utilizing TRIZ would increase the chance of identifying an effective solution to 95%!
| Level | Source of Ideas | Percentage of Problems Solved |
|---|---|---|
| 1 | Company Knowledge (Internal) - Simple improvements. | 32% |
| 2 | Industry Knowledge (External) - Adaptation of solutions used in similar systems from within the same industry. | 45% |
| 3 | Other Industries (External) - Innovative solutions from different industries. | 18% |
| 4 | New Technology (Typically External) - New Materials, Equipment, etc. | ≤ 4% |
| 5 | New Science (Typically External) - New inventions based on a (new) scientific effect. | ≤1% |
Identifying the Contradictions
One of the first things that TRIZ practitioners learn is that “solutions” include contradictions (whether as “trade-offs” or “inherent”). The TRIZ methodology promotes improvement of the system/process towards “ideality” by overcoming the contradictions.
The 40 TRIZ Principles
TRIZ practitioners consult the “40 TRIZ Principles” (below) to assess which one(s) provide possible solutions. Those potential solutions are then evaluated to determine which one comes closest to solving the problem while minimizing the contradiction(s).
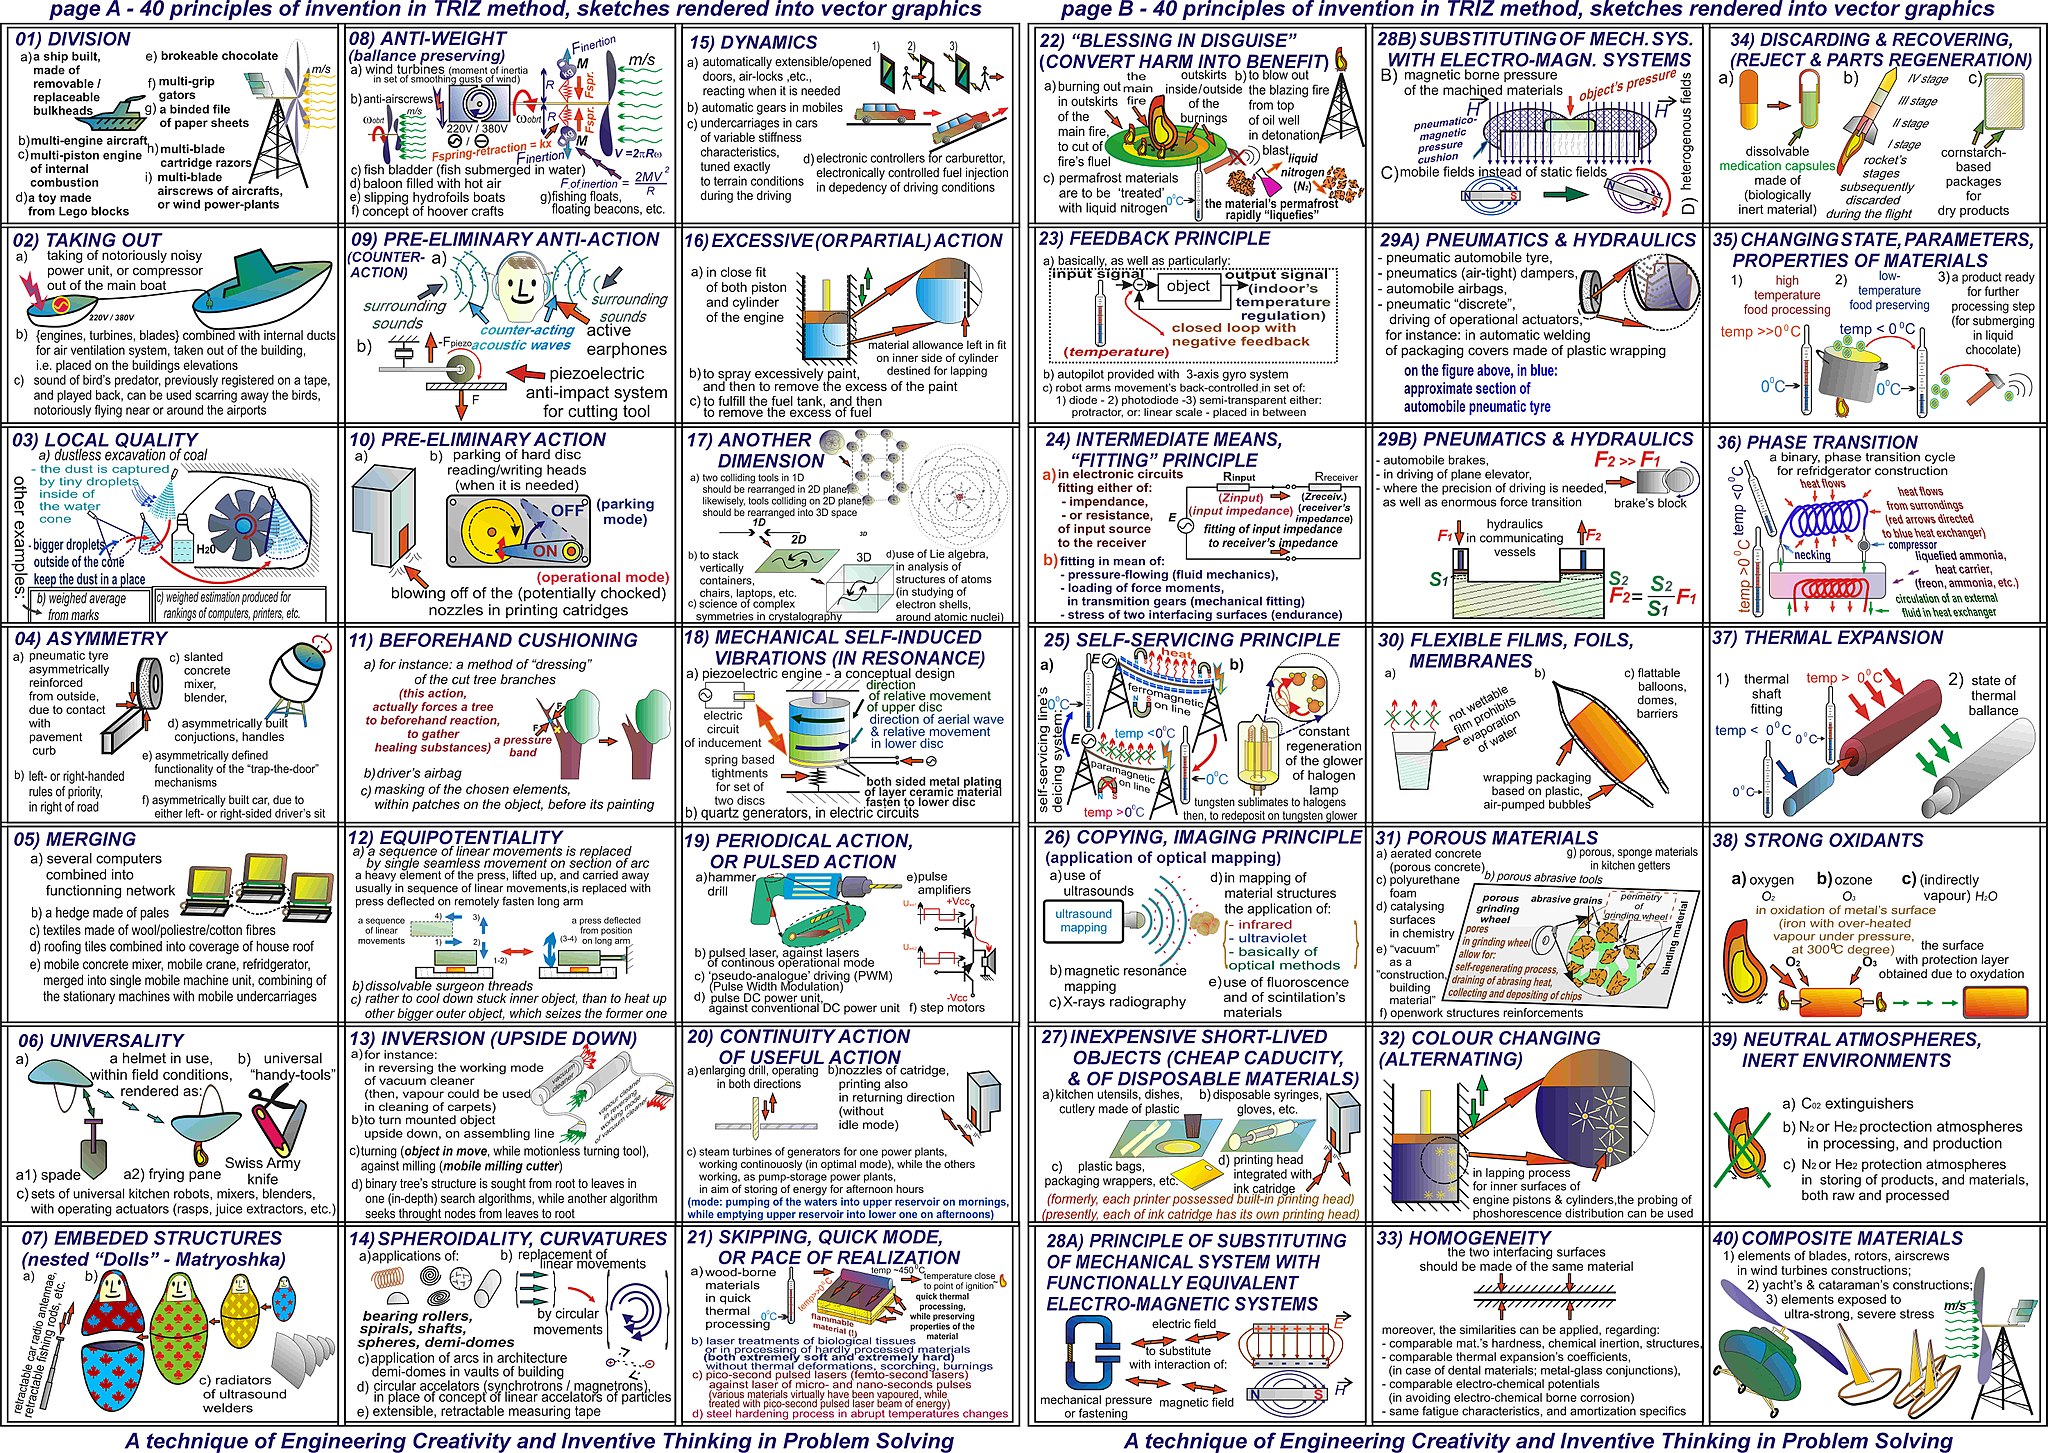
While this section only describes a brief introduction to TRIZ, the “Case Study” below demonstrates how TRIZ “thinking” can facilitate huge improvements. While the case study described provides a solution that would be obvious to many Lean Six Sigma practitioners, it had not been obvious to the company that instituted the change.
A manufacturing company had a six-month backlog in manufacturing its most popular product. This product consisted of a metal cabinet filled with both mechanical and electrical components and subassemblies. The cabinet was about 6' tall and about 2' deep and 3' wide. And it weighed between 300-400 Lbs. once completed. A significant customer complaint was that the finished product arrived with dents and scratches to the exterior.
Probelem Statement:
The manufacturing process is unacceptably long and results in unacceptable cosmetic damage.
Current State:
After completing a study that included a Spaghetti Diagram analysis, management was shocked to learn that, due to inefficiencies in the process flow, each product traveled approx. 6 miles through the relatively small facility before being shipped! The study also revealed that each movement of the product (e.g., during transportation)… even a few inches, was an opportunity for the product to be damaged (e.g., scratches, dents). Also, each time a product is “touched” (handled) by an operator was an opportunity to introduce defects.
Future State:
The company applied TRIZ Principle #16 ”Excessive (or Partial) Action“… reducing both the distance that the product traveled through a process AND the number of times that product was “touched”. This was accomplished by creating a single cell in which the entire product was built. All of the needed components and subassemblies were staged around this cell… until installed. The product was not moved until it was ready to be packaged for shipment.
Results:
Throughput time dropped from 6 months to two (2) weeks! And the number of customer complaints dropped significantly… to almost none. In addition, numerous manual pallet jack lifts and fork trucks were freed from use in transporting the cabinet throughout the facility… which also resulted in a reduction of safety risks to workers.
Control:
The entire DMAIC process relies upon users ensuring that controls are developed and put in place to sustain whatever improvements have been realized. These types of controls can take many, multiple forms. For example:
- Updating Procedures / Work Instructions (to reflect the changes that produced the improvements);
- Updating training materials (to ensure that personnel are trained in the new process);
- Instituting periodic “Process Audits” (to ensure that workers are sustaining the new process);
- Monitoring the output of that process until management is comfortable that the improvements are being sustained;
- Focusing on the changes during internal quality audits (all improvements should be identified as an area of “risk”).