Table of Contents
Downloads
"AS9100-QMS Awareness Training" template in PowerPoint (7/22)

"AS9100-QMS Awareness Training" template (PowerPoint)
This free “AS9100-QMS Awareness Training” template (PowerPoint) provides a solid basis for training your employees in AS9100 sec. 7.3 “Awareness” along with a brief introduction to AS9100. While only 21 slides, this short presentation also covers the redundant “communication” requirements contained in AS 9100, sec. 5.1.1f, 5.2.2b, 5.3 & 6.2f. Further, this “AS9100-QMS Awareness Training” template also includes an “Ethics Policy”; required to qualify for compliance with the optional AS9100 - The Performance-based Surveillance/Recertification (PBS/RP) Program.
The only things that you need to add to this PowerPoint are your:
- Company Quality Policy (Slide # 7)
- Company Quality Objectives (Slide # 8)
- Company High-Level Organization Chart (Slide # 10)
- Management Representative (Slide # 11)
Most companies associate their “Quality Objectives” with “KPIs” (Key Performance Indicators) because managers are more familiar and comfortable with that term. However, managers tend to interpret KPIs as broadly encompassing many different aspects of the business (e.g., financial performance, health, safety, environmental). In reality, a more “specific” term would be “Quality Performance Indicators”. Use of this term would “remind” management that these performance indicators must remain within the scope of the “Quality Management System”.
"Competency Matrix" template in Excel
"Competency Matrix" template in Excel (11/23/24)
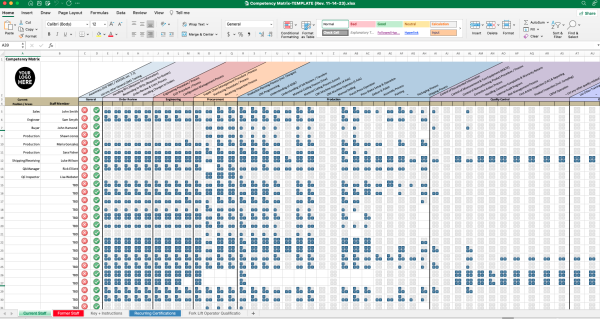
This free “Competency Matrix” template (in Excel) utilizes “Conditional Formatting” to produce graphical block quadrants. Simply enter a space (for no training required) or number (associated with competency levels identified in the “Key + Instructions” tab) into the desired cell to produce the appropriate block icon.
This template provides a simple tool to address ISO 9001/AS9100, section 7.2 “Competency”. AND it has been verified by multiple auditors as being compliant with ISO 9001, AS9100 & AS9120.
For AS9100 series companies, this “Competency Matrix” is considered equivalent to the IAQG SCMH-7.13.3 “Competency Management Template and Example”, Rev-A Dated-27NOV2020.
In the 11/23/24 version, I added AS9146 FOD Prevention Program under the recurring training tab.
Aerospace-specific training topics to consider include:
- AS13000 Problem Solving Requirements for Suppliers (Use of the 8D form)
In addition, this “Competency Matrix” template includes a different sheet (tab) for tracking recurring certifications (e.g., IPC J-Std-001, AWS Certified Welders) and recording Fork Lift Operator Qualifications (Ref. 29 CFR § 1910.178(L) for specific requirements).
Remember to regularly update your “Competency Matrix” as staff adds to their competency.
"SMART Tasks" template in Word (11/24)
"SMART Tasks" template in Word (11/24)
S.M.A.R.T. is a mnemonic acronym, that provides criteria to guide in the setting of goals and objectives for better results. The first known use of the term appeared in the November 1981 issue of “Management Review” by George T. Doran. While there are several minor variations on the acronym, Doran's original definition was:
Specific: target a specific area for improvement.
Measurable: quantify, or at least suggest, an indicator of progress.
Assignable: specify who will do it.
Realistic: state what results can realistically be achieved given available resources.
Time-related: specify when the result can be achieved.
This template adds clarity to how the S.M.A.R.T. concept is to be applied through the use of a form. For example, many users struggled with how to answer “Assignable”. Some would simply say “Yes” in the form. But, as Dorian explained, the point is to actually assign the task to a person or team. And it is important to obtain the agreement; because “assigning” a task to someone who does not agree (or accept) the task (e.g., due to their lack of confidence in its success) is a certain path to failure. Tasks should only be assigned to personnel who “agree” to accept the task.
Similarly, I've changed Realistic to Resourced in the form; because again, some users would simply say “Yes”. However, as Doran explained, if a task is not properly resourced, then it is unrealistic to expect success. Using the word Resourced instead of Realistic in the form prompts users to ensure that the task is properly “resourced”.
Based on the SMART structure, this free “SMART Tasks” template provides a simple tool for management to address ISO 9001/AS9100, sections 9.3.3a (opportunities for improvement) & b (any need for changes to the quality management system). As the “SMART Tasks” template is utilized, it can also be used to address the requirement of ISO 9001/AS9100, sections 9.3.2a (the status of actions from previous management reviews).
A FREE web-based version of a SMART Task app is available at: https://www.smarttask.io/
"SWOT Analysis" template in Word
"SWOT Analysis" template in Word (11/19)
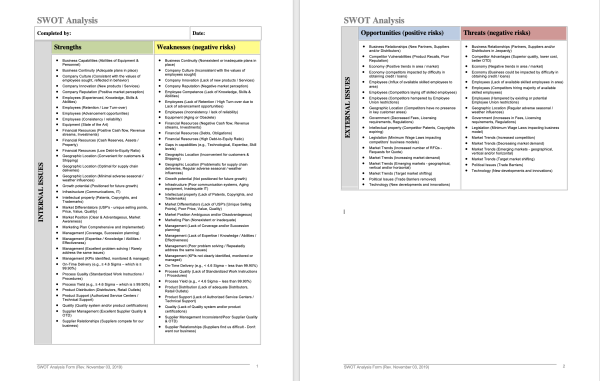
This free “SWOT Analysis” template (in Word) provides a simple tool for management to address ISO 9001/AS9100, sections:
- 4.1 (as talking points to describe “external and internal issues that are relevant to its purpose and its strategic direction and that affect its ability to achieve the intended result(s) of its quality management system.”), and
- 9.3.2b (a “Management Review” record of any “changes in external and internal issues that are relevant to the quality management system.”)
Remember to update your SWOT Analysis annually… in preparation for, or with results from, Management Review Meetings.
A SWOT (Strengths-Weaknesses-Opportunities-Threats) Analysis presents a four-quadrant representation of both internal and external issues facing an organization. A SWOT Analysis is most often used by management to provide an all-encompassing assessment of a business (inclusive of Marketing, Sales, Production, HR, etc.).
While many of the examples in the provided SWOT template go beyond those external and internal issues that affect the organization's “ability to achieve the intended result(s) of its quality management system”, the additional examples were provided because managers are most familiar with the “all-inclusive” approach toward a SWOT Analysis… and often struggle with differentiating the broader “business” issues from the more focused “quality-related” issues. If management is able to make that differentiation, then the examples contained in the template can be reduced to only those issues that are truly quality-related.
However, since ISO 9001/AS9100, sec. 4.1 “Understanding the Organization and Its Context” states: “The ORGANIZATION shall determine external and internal issues…”, as long as management identifies some external and internal issues, there are (generally) no wrong answers when responding to this requirement. Recognizing this, most ISO 9001/AS9100 auditors accept virtually ANY answer provided as satisfying this requirement.
The SWOT analysis provided above is different from a basic/traditional SWOT in that it has a column along the left side (in grey) identifying the top two quadrants (Strengths & Weaknesses) as “internal” issues and the bottom two quadrants (Opportunities & Threats) as “external” issues. In addition, it identifies the “Weaknesses” & “Threats” quadrants as representing negative risks. And the “Opportunities” quadrant as representing positive risks. The concept of positive and negative risks is prevalent in many business situations (particularly when concerning financial decisions). However, both the quality & safety professions adhere to the etymology of the word “risk” as always being negative (having negative consequences or impacts).
To use this template, management should review the issues identified… deleting those that are not applicable, modifying those that are applicable (when needed), and using it as a resource, identify other “quality-related” issues that aren't included in the template.
"Unilateral Cp-Cpk Calculator"
"Unilateral Cp-Cpk Calculator w/trend lines", 2-07-23 (Excel)
You're probably wondering “why” you would need a unilateral Cp-Cpk calculator when your company is probably not utilizing any Control Charts.
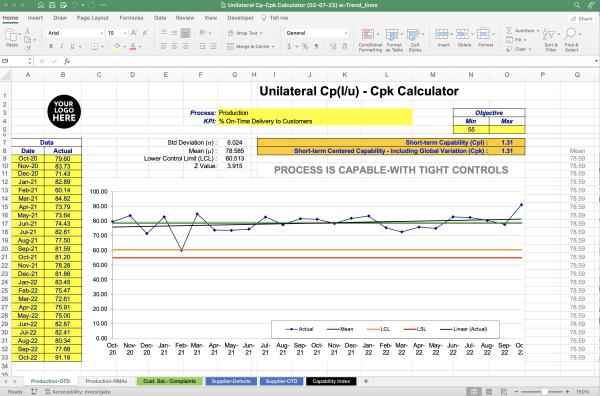
Quite simply, this unilateral Cp-Cpk calculator is designed for you to track trends in your KPIs & “Quality Objectives”.
Both ISO 9001 & the AS91xx series require users to identify “Quality Objectives” (6.2) and, during “Management Review” (9.3.2), to “consider”:
c. information on the performance and effectiveness of the quality management system, including trends in:
2. the extent to which quality objectives have been met;
By entering the data associated with each of your KPIs into this “Process Capability” chart, it will automatically calculate the associated Cp & Cpk. Why should you care? Because IF the process associated with the KPI is NOT capable of achieving the “Quality Objective” determined by management, then the chart will identify this AND provide a basis for management to adjust the “Quality Objective” to one that can actually be achieved!
While the “objective” is a necessary non-value-added component, the true value of understanding the process capability is that this data allows management to better identify where to focus resources in order to improve each process. In addition, this chart can be used to detect seasonal variations and as an “early detection” tool for identifying unfavorable trends.
Anyone familiar with "Demings 14 Points" is aware that ISO 9001 and the AS91xx series ignore Demings Point 11b. “Eliminate management by objective. Eliminate management by numbers, numerical goals. Substitute leadership.”
The primary reasons that Deming opposed “management by objective” are:
- The “objectives” are typically driven by emotion rather than data, are often outside of the process's capability… and are therefore unachievable. This results in the workers being blamed rather than management focusing on improving the processes.
- When an “objective” is achieved, management celebrates success (e.g., the pizza party), losing sight of the true goal… which is continual improvement.
During Deming's time, the concept of a “Quality Management System” was in its infancy. Today, we have Lean, Six Sigma, Lean Six Sigma (a combination of the two) & TRIZ. While these methodologies greatly increase the opportunities for “real” improvements, I remain critical of Deming (and ISO) for not recognizing process “optimization”. If the process is consistently satisfying all customer requirements (e.g., at or better than 6 Sigma levels)… and the customer is not willing to pay more for a product exceeding their requirements, then continually “improving” that process “might” yield no further benefit. Granted, the VAST majority of companies are nowhere near “optimization”.
For more information on Unilateral Process Capability Index Charts, read: “What is Cp and Cpk for unilateral tolerance?"
"Risk Assessment with Column Chart" template in Excel (6-15-2022)
"Risk Assessment - with Column Chart" Template (Excel)
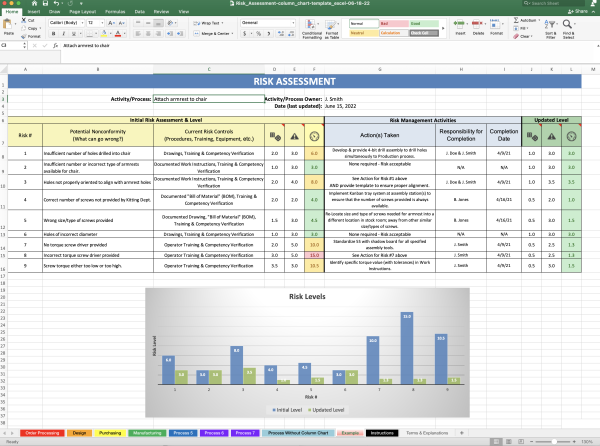
This “Risk Assessment with Column Chart” template (Excel) includes a tab for each of your “key” processes. And allows you to identify up to 9 process risks. Then assign a point score (0-5) for the likelihood (probability) and “Consequences” (Impact) of each risk. These two scores (“Likelihood” and “Consequences”) will automatically be multiplied to produce a “Risk Level” (between 0 and 25). The “Column” chart will automatically update; reflecting the initial “Risk Level” beside the new Risk Level” (If additional risk actions were implemented). IF you don't like the column chart, the light blue tab excludes the column chart… and expands the number of risks that can be identified to 35. This template includes instructions for its use.
Reference the “Instructions” tab in the “Risk Assessment” for information on how to use this form to satisfy the requirements of ISO 9001/AS 9100, sec. 9.3.2e & AS 9100, sec. 9.3.3d through referencing it in your Management Review Meeting Minutes.
You may wonder why I didn't use a standard FMEA (Failure Modes and Effects Analysis). I avoided the FMEA structure because “Detection” is not a part of the definition of “risk”. “Detection” is actually a measure of the effectiveness of a specific type of risk mitigation control. Therefore, including “Detection” as a part of the RPN (Risk Priority Number) distorts the “actual” risk level. However, if you prefer using a FMEA, ASQ provides a free FMEA template.
"Apollo Cause & Effect" Chart in Word (03-19-2023)
"Apollo Cause & Effect" (ACE) Chart (Word)
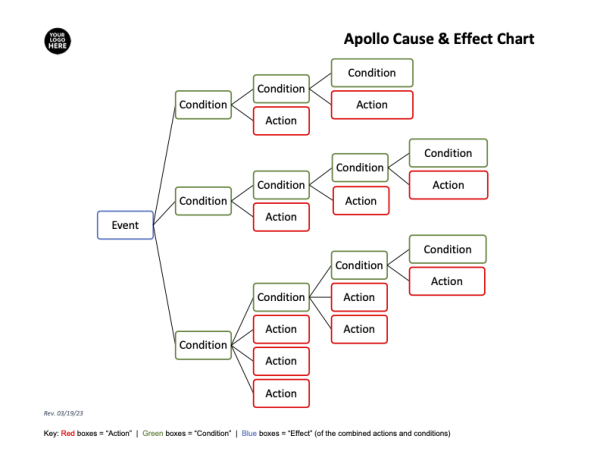
The “Apollo Root Cause Analysis (ARCA)” methodology (described in the book "Apollo Root Cause Analysis: A New Way of Thinking" by Dean L. Gano) focuses on the concept that both a “Condition” and an “Action” must exist and come together to create (cause) an “Event”. An “Apollo Cause and Effect” Chart (aka “Reality Chart”) typically differentiates “Conditions” from “Actions” by color-coding the boxes describing each. While there are several commercial software applications for creating “Apollo Cause and Effect” charts, these can be expensive… and their limited use doesn't justify the cost.
This “Apollo Cause and Effect” (ACE) Chart template was created using the SmartArt feature within Microsoft Word, thus providing an inexpensive (and likely readily available) tool for creating your own ACE charts.
Unlike other legacy quality management tools (e.g., “5 Whys”), “Apollo Root Cause Analysis” recognizes that the term “root cause” is a misnomer. While its creator (Dean L. Gano) claims that there are an infinite number of causes… thus prohibiting a “root cause” from ever being identified, I would posit that identifying a “root cause” is possible, but extraordinarily rare. One of the core concepts of “Apollo Root Cause Analysis” is to identify as many causes as possible and try to develop ways to eliminate or mitigate as many of them as possible. Ultimately, the purpose of “corrective action” is to prevent the “recurrence” of a nonconformity… not to identify the mythical “root cause”.
While I like this approach, it still falls short in the area of actual problem-solving because it assumes that if enough “causes” are eliminated, the problem will eventually reach a point of acceptability. And this is logical. However, “Apollo Root Cause Analysis” becomes significantly more effective when used in conjunction with TRIZ. However, I do find the ARCA methodology a highly useful tool for “Cause and Effect” Analysis. While it is certainly superior to other methodologies.
If you're considering a class in Root Cause Analysis, don't waste your money on learning flawed concepts. Instead, check out the Apollo Root Cause Analysis Training Courses (available in-person OR online).
"Risk-Based Audit Planning Criteria" template in MS Word (08/22)
 "Risk-Based Audit Planning Criteria" template in MS Word (08/22)
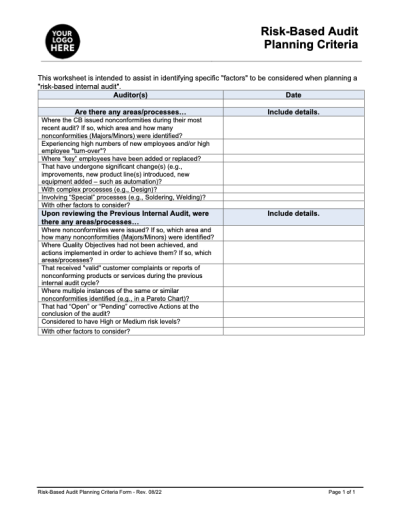
This free “Risk-Based Audit Planning Criteria” form (in MS Word) provides a series of basic questions to determine the “risks” that should be “considered” when scheduling an internal audit.
This form provides a way to address one of the new AS9104/1A, OCAP requirements (reducing your organizational risk as determined by your CB). The criteria for having a “low risk” internal audit program includes:
- Properly resourced audit program
- Multi-event audit program, audit full QMS annually
- Audit program driven by risk and data
- Effective corrective action program
For a more detailed discussion on risk-based auditing, read my article "Risk-Based Internal Audits".
"Calibration Recall" template Excel (5-5-2018)
"Calibration Recall" template Excel (5-5-2018)
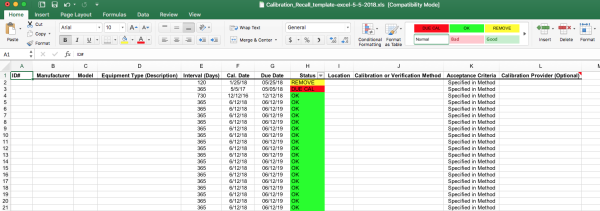
This simple Excel-based “Calibration Recall” template is designed for small companies (with under 150 instruments under calibration control) to comply with ISO 9001:2015 & AS9100D. It uses Color-coded “Conditional Cell Formatting” for visual management.
"DPMO-Sigma-Yield-Cpk Conversion Table Wallpaper" (1920x1080)
"DPMO-Sigma-Yield-Cpk Conversion Table Wallpaper" (1920x1080)
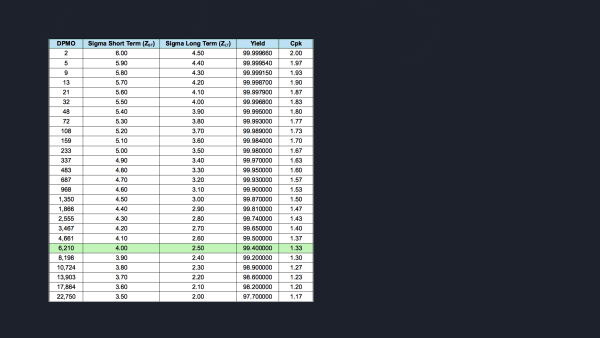
This is a “DPMO-Sigma-Yield-Cpk Conversion Table” with a black background, suitable for use as computer desktop wallpaper. The PNG image provides a quick reference to convert Yields to DPMOs to Sigma levels (Short Term & Long Term) as well as Cpk. This chart covers a range of 3.50 to 6.00 Sigma Short Term (ZST). And the row at 4.00 Sigma Short Term (ZST) is highlighted in light green to indicate a minimum acceptable process capability of 1.33 Cpk.
Metrological (Calibration) Confirmation / Verification Procedures
T.O. 33k1-4-141-1, Calibration Procedure for Multimeters (30 August 2005) Size=765k
T.O. 33k6-4-552-1, Calibration Procedure for Calipers-General (30 July 2013) Size=206k
Torque tool users may also find TO 32B14-3-1-101 "Technical Manual - Operation and Service Instructions Torque Indicating Devices" to be beneficial.
T.O. 33k6-4-427-1, Calibration Procedure for Pressure Gauge (30 May 2012) Size=101k
T.O. 33k5-4-42-1, Calibration Procedure for Thermometers (30 January 2006) Size=60k
Federal Specifications, section 4, “Quality Assurance Provisions”, addresses methodologies for calibration:
GGG-G-17C, Federal Specification: General Purpose Gages (June 26 1987) Size=3.1M
GGG-P-463C, Federal Specification: Surface Plate (Granite) (September 10, 1973) Size=1.7M
GGG-P-463C, Federal Specification: Surface Plate (Granite) - Amendment 1 (June 15, 1977) Size=402k
GGG-R-791H, Federal Specification: Measuring Rules (19 July 1994) Size=993k
GGG-T-106F, Federal Specification: Tape, Measuring (General Use) (April 12, 1993) Size=3.2M
The "Technical Service Center" for the “U.S. Department of the Interior Bureau of Reclamation” also has several publically available calibration procedures. Some of their most popular calibration procedures are:
USBR 1000-89, "Procedure for Standards for Linear Measurement Devices"
USBR 1007-89, "Procedure for Calibrating Dial Indicators"
USBR 1012-89, "Procedure for Calibrating Balances or Scales"
USBR 1020-89, "Procedure for Calibrating Ovens"
USBR 1040-89, "Procedure for Calibrating Pressure Gauges"
USBR 1045-89, "Procedure for Calibrating Force Transducers (Load Cells)"
USBR 1050-89, "Procedure for Calibrating Pressure Transducers"
USBR 1055-89, "Procedure for Calibrating Differential Pressure Transducers"
For calibrating most weighing scales, refer to NIST Handbook 44, section 2.20, subsection N.1.1, “Test Procedures”.
For calibrating Stopwatches & Timers, refer to “NIST Special Publication 960-12”, sec. 5; available online at: Stopwatch and Timer Calibrations (2009 edition)
For calibrating (verifying) hydrometers, refer to: ASTM E 126, "Standard Method for Inspection and Verification of Hydrometers".
For calibrating volumetric glassware, refer to ASTM E 456, "Standard Practice for Calibration of Laboratory Volumetric Apparatus".
For calibrating (verifying) Rockwell Hardness Testers, refer to: ASTM E 18, "Standard Test Methods for Rockwell Hardness of Metallic Materials".
For calibrating (verifying) Wire Cloth Sieves, refer to: ASTM E 11, "Standard Specification for Wire-Cloth Sieves for Testing Purposes", Appendix X1, “Methods of Checking Wire Cloth Sieves to Determine Whether they Conform to Specifications”.
